WordPress MicroPayments (CMMP) - How To - Display Reports (Point Usage)
Switching Report Types
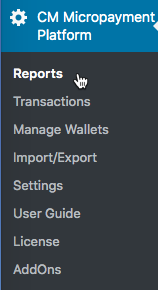
To find WordPress MicroPayments reports, head to Settings → Reports.
Report Types
There are two types of reports available:
- Graph Report
- List Report
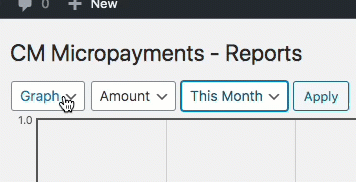
To switch between them you need to select the type you want from the first dropdown on the left and click Apply.
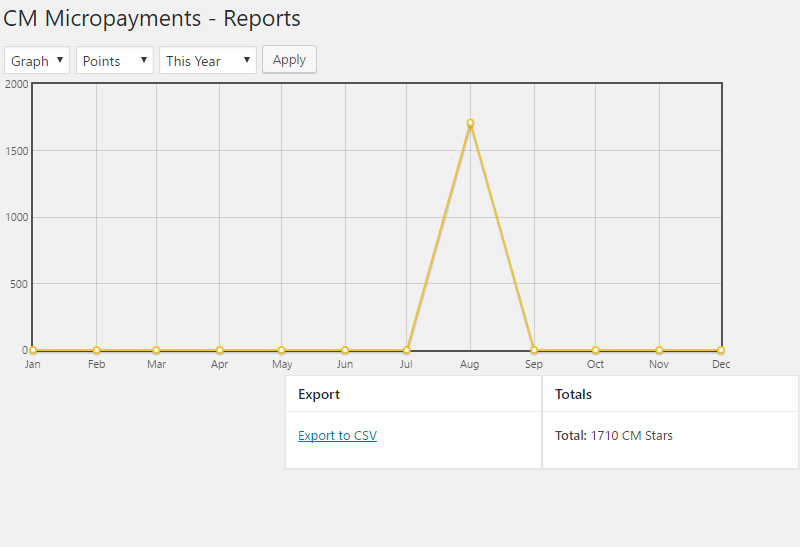
Graph Report
The first type of report allows you to see the graph displaying the data about the flow of the points in your system.
You can manipulate the data displayed on the graph in two ways:
By changing the type of data displayed:
- Points - displays the amounts of points being used in transactions
- Count - displays the amount of different transactions which take place
- Amount - displays the value of the transactions in the real-life currency
By changing the timeframe (using the third dropdown).
Example
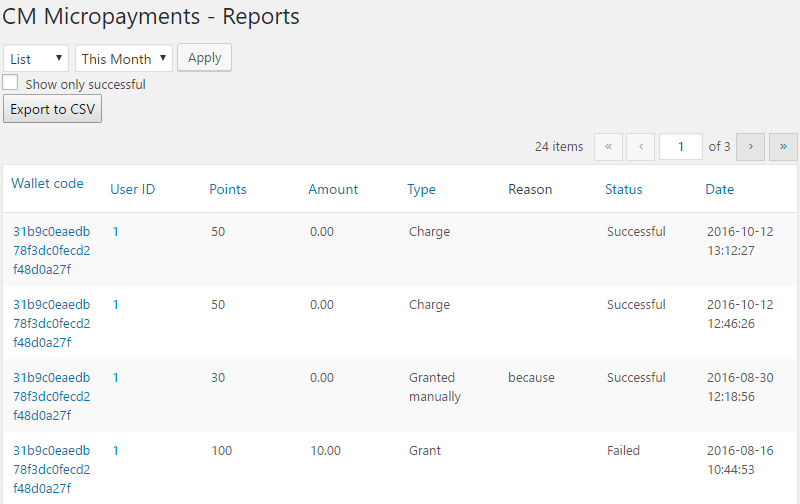
List Report
The second type of report allows you to list all of the wallet transactions and filter them by date and by status (Successful only or All).
Things you can change on this screen:
- Timeframe - by using the dropdown next to Apply button, you can select the timeframe you'd like to display
- Status - by selecting "Show only successful' you can filter out the transactions which have failed for any reason
- Page - by using the numbers and arrows over and under the table you can change the pages of the data
Example
 |
More information about the WordPress MicroPayments plugin Other WordPress products can be found at CreativeMinds WordPress Store |
 |
Let us know how we can Improve this Product Documentation Page To open a Support Ticket visit our support center |